Introduction
Capital Fund 1 (CF1) is proud to present our Fourth Quarter 2019 update. Once again, our goal is to capitalize on growth opportunities, forecast turbulence in the near to long term real estate market, and to stay up to date on current market trends. We at CF1 believe this research provides both our Company and Shareholders the best opportunity to capitalize on growth opportunities while assessing trends and risks in the ever-changing marketplace. We strive to implement this knowledge when underwriting every loan prior to inclusion in our portfolio for the security of our Shareholders.
The following report is a summary of data points taken from local and national sources and our analysis of the same. The primary sources relied upon by CF1 for this report include Arizona Regional Multiple Listing Service (ARMLS), R.O.I. Properties, National Association of Home Builders, CoStar Analytics, The National Association of Realtors and The Belfiore Report.
These reports are intended to share our thoughts with you on the most recent market data and where the market may be headed. We hope you find this report informative and helpful.
Single-Family
The following charts are through December 2019 from the Arizona Residential Multiple Listing Service (ARMLS)
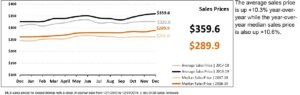
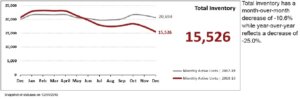
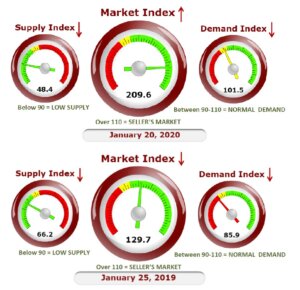
2019 ended as one for the history books, climbing to the top rankings in total sales volume per year, highest median and average sales prices, and fourth highest number of homes sold. This was all accomplished with the record low inventory numbers of just over two months of supply during the final half of the year. To say that 2019 put on a spectacular show would be an understatement, which is reflected in an increasingly strong seller’s market and normal demand despite decreasing supply. As Shown above, 2020 is starting with a staggering 25% decrease in total inventory YoY with no immediate remedy for the decreasing supply. The number of new home permits are up but will provide minimal relief with increasing migration numbers and popular growth. We will delve deeper into this in the Residential Construction Section to see what would be needed to keep up with all the pent-up demand, but as seen below we have had a remarkable year and the market index reflects this.
Limited supply has rippling repercussions across the residential real estate marketplace. iBuyers (Zillow, OpenDoor, OfferPad) targeted Phoenix because the homogenous supply of homes allows their algorithms to target “buy box” properties that are comparable to their neighbors. In their recent history, these iBuyers have been aggressive in sub $300,000 markets such as Glendale, South Phoenix, and pockets of affordable starter homes across the Metro. As home prices continue to appreciate, this set of buyers is being pushed out of their buy box, which is reflected in a 13% decrease in acquisitions and a net decrease in their inventory to end 2019. 2020 has supply-demand principals of continued price appreciation, so it remains to be seen how this buyer pool will compete as one of the nation’s most affordable Metros becomes more expensive.
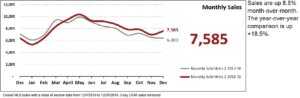
ARMLS Yearly Sales
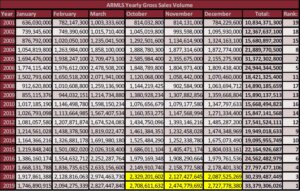
Above we can see the tremendous surge of sales volume to end of the year, coming out ahead YoY every month of Q4. We ended with $1,350,000,000 more in sales volume YoY, finally toppling 2005 with a 17% increase in sales volume over Q4 2018. The Most remarkable part of this is that we did this with historically low inventory numbers and close to two months of supply. It makes one imagine what the market would look like if its inventory could keep up with demand.
We all know the story of subprime lending in 2005-2007. In the years leading up to the Great Recession, borrowers could refinance their mortgages without documenting their employment status, and out of pocket fees could be rolled into this refinance. A traditional lender could also do no-doc loans with no proof of income and 100% financing on these loans. Those with homes found that the incredible appreciation let them pull cash out of the home, and then it all came crashing down. In 2005 the median down payment for a first-time home buyer was 2% with 43% of those buyers making no down payment at all according to the National Association of Realtors. 22% of transactions had a 20% or greater down payment and 8% were cash sales. Additionally, we find that in 2006 11.6% of homes purchased with a down payment of 100% were foreclosed, the underwriting standards were broken and eventually the market caught up to the fabricated figures. When we look at the market today, we see a different landscape. From a recent ARMLS Stat report we have a breakdown on current real estate transactions. We see that currently in Maricopa County 28% of homes put down 3% or less, 29% have a 20% or greater down payment and 17% are cash sales. These are all positive indicators that real dollars are being used in today’s real estate landscape. We also have historically low foreclosure rates in Arizona at 0.2%.
Phoenix also continues to benefit from migration from all over the country, especially our neighbor to the west in California. From a recently published Redfin Migration Report, Phoenix was named as the top destination in the country. We are supported by the migration of large businesses relocating from Los Angeles, San Francisco, and Seattle for relatively low cost of living, limited natural disasters, and an increasingly educated workforce focused in the East Valley. These positives are great for the overall wellbeing of our marketplace but have created a competitive housing environment where our borrowers must compete with iBuyers (Opendoor, Offerpad, Redfin, Zillow, Trulia), increased migration activity, and people living in Phoenix benefitting from the healthy growth in our market.
Residential Construction
Residential construction is the hopeful underdog with the solution to the supply problem. Before the Great Recession, construction numbers were tremendous to keep up with the hyper-inflated market. The fallout of the market left Phoenix overbuilt, a problem that is a distant memory for those active in the real estate market today. Today, we see an increase of 9% in total permit numbers YoY, up to 24,476 from 22,437 in 2018. Much of this comes in the fourth quarter, with 6,005 permits in 2019 vs 4,968 in 2018.
Mike Anderson, our own CEO, put an interesting perspective on the inventory problem- how much land would be needed to bring supply into balance? Well, we are going to explore this question deeper to visualize this on our city grid. To do this, we will need some assumptions summarized below.
• First, we need a timeline. We will do a one-year period through 2021 for simplicity.
• Next, the number of new households. Census.gov provides us with a net migration number of 81,244 from 2017-2018. This source is accurate, so we will use this number as an estimate.
• Census.gov also provides the average people per household in Phoenix- 2.87. Taken together, we now have 28,308 new households per year.
• Now, how many households will rent instead of own? Rentcafe.com, among other sources, estimates that 64% of households will own. That leaves 18,117 new homes from 28,308 above.
• What about infrastructure? Roads, curbs, gutters, open space, etc. This number varies widely between municipalities, but for simplicity, we will call this 25%.
• Finally, we need lot sizes. We will use a pair of the most common sizes historically used in Maricopa County-6,000 and 12,000 SF.
Now, what does all this data look like put together? This simple chart below has the math breakdown for how many square miles of land will be needed.
Below you will see the difference of needed land for 6,000 square foot lots and 12,000 square foot lots with the basis of:
• Population Growth: 81,244
• People Per Household: 2.87
• Percentage of Buyers: 64%
• Number of Households: 18,177
But the point of this exercise is to see it, which we can do over Glendale below. Keep in mind, this is per year, non- compounding, and assumes the whole block is built out with residential and no commercial
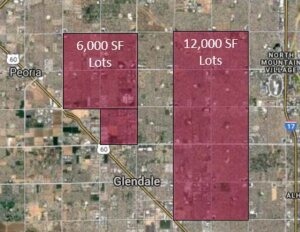
This visual really puts demand into perspective for me. Historically, Phoenix has had the advantage of building out instead of up. Sprawling across our desert has provided people with something that many metros lack- land and short commutes. After more than 50 years of growth, this system has become increasingly unsustainable as Phoenix continues to build further and further away to meet demand. Right now, a drive from Casa Grande or Queen Creek to our office near Kierland is more than 1.5 hours one way. We will eventually reach a point where there is nowhere else to go, with the newest development already far from city centers. However, creative real estate investors will always find a way and at CF1, we have the unique position of supplementing some of this supply. By carefully funding land and infill developments alongside fix and flip homes, we help provide some relief for areas with limited development opportunities. We fund projects that are eventually sold to those looking for their place here in the Valley of the Sun.
Commercial
Below is a synopsis on the major sectors we finance in the commercial marketplace. The information below is more technical and useless language, specific to the sector, so some definitions are provided here for reference and clarity.
Availability Rate
The percent of space available on the last day of each quarter or the current date in the case of the current quarter. Total Available SF Divided by the Total Rentable Building Area (RBA) on the last day of each quarter
Effective Rent
The average rent paid over the term by a tenant adjusted downward for concessions paid by the landlord.
Net Absorption
For existing buildings, the measure of total square feet occupied (indicated as a Move-In) less the total space vacated (indicated as a Move-Out) over a given period.
Relet Space
Sometimes called second-generation space, refers to the space that has previously been occupied by another tenant.
Vacancy Rate
Expressed as a percentage – it identifies the amount of New/Relet/Sublet space vacant divided by the existing RBA. It can be used for buildings or markets.
Multifamily
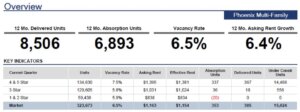
Our market has done it again-2019 marks the second straight year of the Phoenix Metro being the top market for multifamily rent growth! The rent growth from the past year has pushed investors to be more bullish with the asset type, pushing cap rates to cyclical lows of below 6%. This growth still offers a 150-200 basis point spread over California multifamily investment rates. We have also reached pre-recession lows of 6.5% vacancy market-wide and had more than 7,200 units delivered in 2019- the second-highest level this decade. With all the upward pressure, increased rent growth, low vacancies we have seen the average sales price per unit reach $170,000/unit across the market according to Costar.
With the red-hot multifamily industry, we have seen an uptick in the number of requests and a notably higher purchase price per unit. We will continue to monitor each transaction to make sure what they buy is based on the market, not the hype.
Industrial
The Phoenix industrial market continues to benefit from the low cost of doing business and the proximity to major regional markets. We saw an abundance of retailers come into our marketplace to benefit from our strengths. Notable names include Nike, Amazon, Brooklyn Bedding, and Walmart contributed nearly 1,750,000 SF of industrial space in 2019. We can also see a whopping 10 million square feet under construction in logistics alone, bringing another 4% of this product to the marketplace.
Rent growth has followed the growing inventory. Historically, Phoenix has been an underperforming market for industrial rent growth, but with the speculative deliveries and strong demand, we have seen rent growth end 4.8% YoY.
As before, large, new industrial properties continue to benefit from our strong market but at CF1 we do not see these projects. We look more at owner-user opportunities, which we diligently screen for functional obsolescence, adaptive reuse if we take the property back, and location to ensure this part of our portfolio remains healthy.
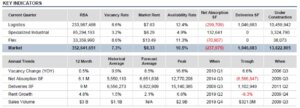
Retail
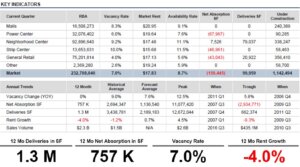
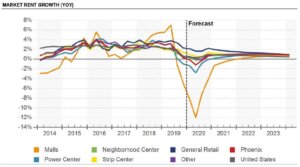
Brick and Mortar retail continues to be the laggard across commercial assets, posting the only negative 12 Mo Rent Growth figure according to Costar. Despite this, the overall fundamentals of retail show that it is not going anywhere. Costar evaluates the net absorption numbers and provides a succinct summary where national retailers are expanding along the path of growth. They are picking top tier space in these emerging suburbs where our metro footprint is expanding into while local retailers take the relet space behind the expanding national chain, their previous box they vacate. They will build out the shell to fill their needs and take the second- generation space in an older market. This explains the low vacancies of 7%, so if a business can find a way to operate in relet space, they will continue to try while the economy is good. Overall demand has fallen to below 1 million SF, the lowest since 2011 and new retail continues to be more internet resistant businesses like car washes and entertainment.
The rent growth expectations are slightly skewed when taken as a whole picture. When the market is instead broken down by segments, we can see a clearer picture
We see a variety of retail projects at CF1. We take measures to provide financing to internet resistant financing with positive P&L statements to ensure the health of the retailer. This also continues to be one of the lowest threshold loans we provide, making our borrowers bring significant capital to the transaction to ensure their desire to remain in the investment.