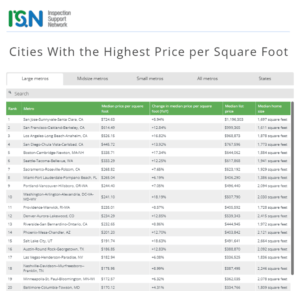
Cities With the Most Expensive Homes per Square Foot
Photo Credit: Alamy Stock Photo
One of the COVID-19 pandemic’s most noteworthy economic effects is the unusual set of conditions currently facing the real estate market.
After a full year of working and schooling from home—and with many employers considering whether to continue remote work arrangements even after the pandemic is under control—living space is at a premium. Simultaneously, government stabilization and stimulus measures during the pandemic, including sustained low-interest rates and multiple rounds of cash payments to individual households, have pumped money into the economy. For middle and upper-income earners whose jobs easily transitioned to remote work—and never experienced the economic shock of losing a job—these measures have helped boost savings rates to record levels. A growing number of would-be homebuyers now have both motivation and means to buy.
But buyers’ interest has not been met with a surge of supply, and inventories are at record low levels. Potential sellers can recognize how competitive the market is for buyers and may be hesitant to move on from their current homes given how difficult it could be to find a new one. And the laws of economics hold true: when demand is high and supply is low, the outcome is rising prices.
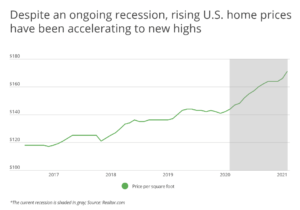
Over the last year, the average price of U.S. residential real estate is up $27 per square foot from February 2020 to February 2021, an increase of nearly 20%. Despite the massive shock to the economy during last spring’s stay-at-home orders and the uneven recovery since states began to reopen, the trend of rising home prices has continued unabated throughout 2020 and 2021.
With prices rising, one trend to watch will be whether buyers abandon expensive, high-demand markets in favor of more affordable locations. The pandemic has made virtual work more common than ever, and employees’ physical presence at the office is not the requirement it once was. Moving forward, workers may decide that they would rather have more space at a lower cost, even if it means living further away from work or putting down roots in a less glamorous locale.
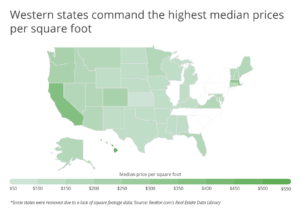
At the state level, this could lead to migration away from certain Western states like Hawaii, California, and Washington that are currently among the most expensive per square foot. In contrast, many locations in the South and Midwest could be the beneficiaries of workers looking for more affordable alternatives. States like Kansas, Mississippi, Arkansas, and Indiana have median prices per square foot around $100—less than one-fifth of the median in Hawaii and less than one-third of the median in California.
The effect will likely be even more pronounced at the local level. Some of the nation’s most expensive metro markets, like California’s Bay Area metros of San Jose and San Francisco, have already seen more residents leave the urban core for suburbs and exurbs further out—or move away from the state altogether. Not coincidentally, these metros have not experienced quite the same explosive increases in home prices seen in other markets this year.
To find the residential real estate markets with the highest price per square foot, researchers at Inspection Support Network used data from Realtor.com and the U.S. Census Bureau. The research team calculated the median price per square foot for 2020, as well as the change in median price per square foot from 2019 to 2020. They also included data about median list price and median home size for comparison.
Here are the U.S. metropolitan areas with the most expensive homes per square foot.
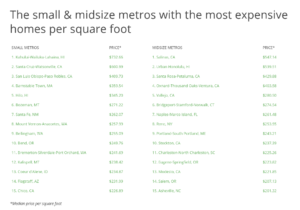
Large Metros With the Most Expensive Homes per Square Foot
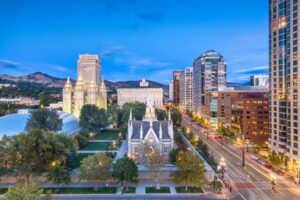
Photo Credit: Alamy Stock Photo
15. Salt Lake City, UT
- Median price per square foot: $191.74
- Change in median price per square foot (YoY): +18.63%
- Median list price: $491,641
- Median home size: 2,664 square feet

Photo Credit: Alamy Stock Photo
14. Phoenix-Mesa-Chandler, AZ
- Median price per square foot: $201.20
- Change in median price per square foot (YoY): +12.70%
- Median list price: $403,842
- Median home size: 2,121 square feet
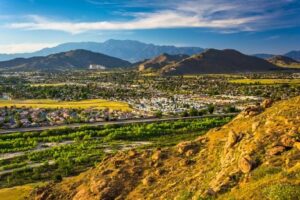
Photo Credit: Alamy Stock Photo
13. Riverside-San Bernardino-Ontario, CA
- Median price per square foot: $232.65
- Change in median price per square foot (YoY): +8.86%
- Median list price: $444,945
- Median home size: 1,972 square feet

Photo Credit: Alamy Stock Photo
12. Denver-Aurora-Lakewood, CO
- Median price per square foot: $234.29
- Change in median price per square foot (YoY): +12.85%
- Median list price: $539,343
- Median home size: 2,415 square feet
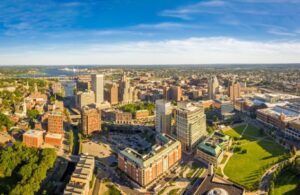
Photo Credit: Alamy Stock Photo
11. Providence-Warwick, RI-MA
- Median price per square foot: $235.01
- Change in median price per square foot (YoY): +8.57%
- Median list price: $405,592
- Median home size: 1,728 square feet

Photo Credit: Alamy Stock Photo
10. Washington-Arlington-Alexandria, DC-VA-MD-WV
- Median price per square foot: $241.10
- Change in median price per square foot (YoY): +18.19%
- Median list price: $507,790
- Median home size: 2,030 square feet

Photo Credit: Alamy Stock Photo
9. Portland-Vancouver-Hillsboro, OR-WA
- Median price per square foot: $244.40
- Change in median price per square foot (YoY): +7.05%
- Median list price: $496,440
- Median home size: 2,094 square feet
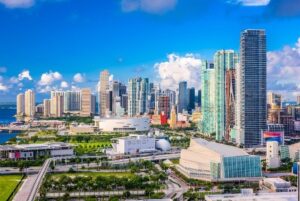
Photo Credit: Alamy Stock Photo
8. Miami-Fort Lauderdale-Pompano Beach, FL
- Median price per square foot: $265.04
- Change in median price per square foot (YoY): +6.19%
- Median list price: $406,290
- Median home size: 1,386 square feet

Photo Credit: Alamy Stock Photo
7. Sacramento-Roseville-Folsom, CA
- Median price per square foot: $268.82
- Change in median price per square foot (YoY): +7.65%
- Median list price: $523,192
- Median home size: 1,929 square feet

Photo Credit: Alamy Stock Photo
6. Seattle-Tacoma-Bellevue, WA
- Median price per square foot: $333.29
- Change in median price per square foot (YoY): +12.25%
- Median list price: $617,868
- Median home size: 1,941 square feet

Photo Credit: Alamy Stock Photo
5. Boston-Cambridge-Newton, MA-NH
- Median price per square foot: $338.71
- Change in median price per square foot (YoY): +17.34%
- Median list price: $644,062
- Median home size: 1,884 square feet
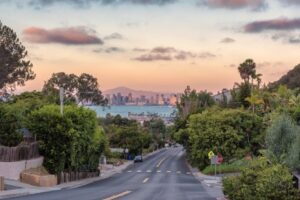
Photo Credit: Alamy Stock Photo
4. San Diego-Chula Vista-Carlsbad, CA
- Median price per square foot: $445.72
- Change in median price per square foot (YoY): +13.92%
- Median list price: $767,596
- Median home size: 1,773 square feet

Photo Credit: Alamy Stock Photo
3. Los Angeles-Long Beach-Anaheim, CA
- Median price per square foot: $526.15
- Change in median price per square foot (YoY): +16.82%
- Median list price: $968,873
- Median home size: 1,878 square feet

Photo Credit: Alamy Stock Photo
2. San Francisco-Oakland-Berkeley, CA
- Median price per square foot: $614.49
- Change in median price per square foot (YoY): +12.84%
- Median list price: $999,365
- Median home size: 1,611 square feet

Photo Credit: Alamy Stock Photo
1. San Jose-Sunnyvale-Santa Clara, CA
- Median price per square foot: $724.63
- Change in median price per square foot (YoY): +5.94%
- Median list price: $1,196,303
- Median home size: 1,697 square feet
Methodology & Detailed Findings
To find the locations with the most expensive homes per square foot, researchers used data from Realtor.com’s Real Estate Data Library. The year-over-year change in the median price per square foot was calculated using 2019 and 2020 home price data. Population data came from the U.S. Census Bureau’s 2019 American Community Survey. To improve relevance, only metros with at least 100,000 residents were included in the analysis. Metros were further grouped into size cohorts based on population: small (100,000–349,999), midsize (350,000–999,999), and large (1,000,000 or more). Certain geographies were removed from the analysis due to insufficient square footage data.
https://www.inspectionsupport.net/resources/cities-with-the-highest-price-per-square-foot/
Originally posted in ISN